ABSTRACT
Coffee & Climate is a visual journal meant to represent real time data of weather temperature from major coffee producing countries. Each country is represented by a unique generative shape, which reflects its size and ranking in the global export of green coffee. Augmented Reality (AR) technology is used to provide viewers with a dynamic visualization of the weather data. The book aims to provide an immersive and nature-centric approach to climate visualization for the coffee industry, with the purpose of increasing awareness and understanding of the impact of climate change on coffee production. By promoting sustainability through collective action, Coffee & Climate seeks to inspire positive change within the coffee sector.
Introduction
Coffee farming is under threat as the planet's climate becomes increasingly unpredictable. Smallholder farmers in developing countries, who rely on coffee as their main source of income, are particularly vulnerable to the impacts of climate change, as Morton (2007) warns. With irregular weather patterns, warmer temperatures, and increased outbreaks of pests and diseases, these farmers risk losing their livelihoods entirely. The correlation between climatic variability and green bean yield, as noted by Davis et al. (2012), underscores the severity of the situation. Coffee arabica, in particular, is highly sensitive to changes in environmental conditions, and requires very specific weather patterns in order to thrive.
The coffee industry is feeling the effects of climate change throughout its entire value chain, from producers to consumers. Burkey et al. (2022) report that demand for coffee is increasing, and in order to keep up with forecasts, production will need to double within the next 30 years. However, this goal is threatened by unpredictable weather patterns, which could lead to decreased yields and potentially not meeting demand. In response, the industry must prioritize sustainability and resilience in order to continue to thrive. This requires accountability and a concerted effort to incorporate environmental considerations throughout all sectors of the industry. The coffee industry can overcome the challenges posed by climate change by taking action and devising strategies to mitigate its impact.
Nature-Centred Design
Coffee & Climate is exploring the intersection of art, design and technology to respond to environmental challenges, centering its approach nature. Craig (2013) introduces the concept of Augmented Reality as a medium that allows for new forms of engagement between humans and technology. Coffee & Climate is expanding on this idea to create a space of engagement between nature, technology and humans. The project seeks to reimagine the way readers engage with information and data by merging traditional book media with an immersive AR experience and integrating weather data into the visual animations. This approach seeks to enhance understanding of climate change and its impact on the coffee industry, helping readers connect with nature and take action for a sustainable future.
Examples of Nature-Centred Design
MIT's media lab project, Making Data Matter, approaches design from a nature-centric perspective. The primary focus of Making Data Matter is on scientific visualizations within the medical sector. Using a multi-material voxel-printing approach, they enable the physical representation of data sets. The Mediated Matter Group (2018) describes their approach to data workflows as bridging the gap between digital information and physical material composition, pushing the boundaries of data representation. Their research takes into consideration the materials used, informing datasets of point cloud data and volumetric data when creating 3D physical objects.[i]
Another perspective on nature-centred data visualization can be observed in the real-time generative art created by Parse/Error. Fabien Bouchard, also known as Parse/Error, is an artist who focuses on data visualization through interactive installations and immersive experiences. He explores the use of real-time data that is sourced from users, sensors, and the internet. By incorporating this data into his art, viewers are fully immersed and can experience the artwork in a dynamic way. Bouchard's approach to generative art is based on the idea of constant evolution and the responsibility of humans to create in the present moment. Real-time data serves as a foundation for a reflection on the interaction between humans, nature, and the environment, as explained by Bouchard (2021).
One of Parse/Error's notable projects, Instability of Nature (2018)[ii], demonstrates his use of real-time data in interactive installations. In this project, Parse/Error utilizes a Geiger-Müller device to detect beta and gamma ionizing radiations released by radioactive items. The artwork conceals its true nature behind a visually appealing object. When the viewer realizes the object's purpose, their behaviour shifts. The project aims to draw attention to the fact that radioactivity is a natural and pervasive phenomenon in nature, but human activities have transformed it into an invisible and alarming threat, such as nuclear disasters, radioactive waste, and atomic bombs.
In addition, Parse/Error's work includes an installation piece called Pollution, is in the air (2020)[iii], which responds in real-time to air pollution. The piece uses its own geolocation to display the local air quality index using a series of colourful lights. The lights react based on the Air Quality Index scale and the concentrations of pollutants present in the air. This piece serves as a powerful reminder of the impact of human activity on the environment and the urgent need to take action to mitigate the effects of pollution.
The discussed projects spark conversations about the possibility of technology coexisting with nature-centred design. Through new media art and design, it is possible to communicate system change that is in complete synergy with the environment. By allowing nature to inform the way we design and create, we can create a harmonious relationship between technology, humans and the natural world. Drawing inspiration from these ideas, Coffee & Climate aims to engage with both traditional and new mediums, not only to aesthetically represent data, but also to connect with our environment and serve nature.
Data Visualization
Coffee & Climate employs a dual approach to generate two distinct outputs using different kinds of datasets. Real-time visualization is needed to capture the constantly changing weather temperature, and Augmented Reality is the ideal platform for this dynamic representation. In contrast, generative shapes assigned to each country take a more static approach, which can be effectively represented in a print form.
Fixed Data Exploration
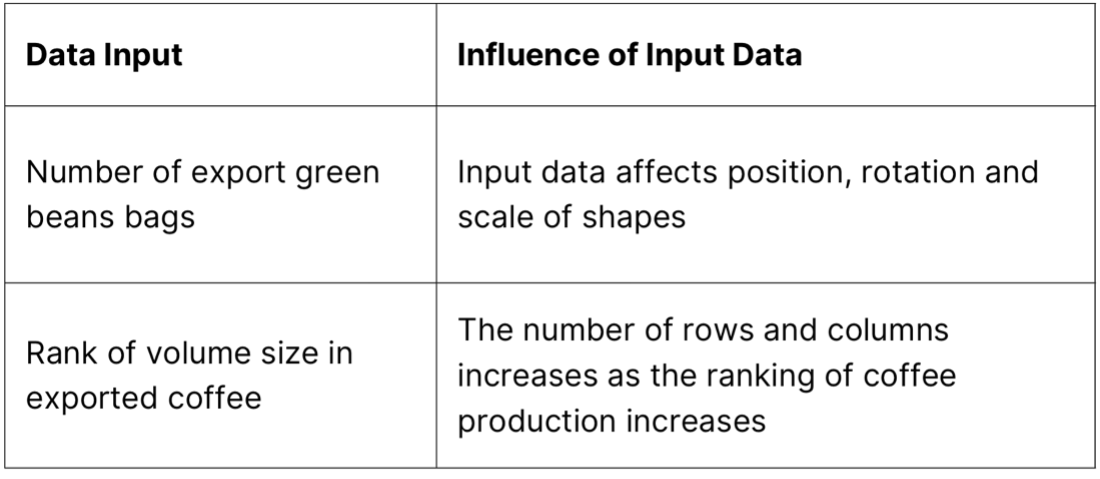
Each country needed a unique representation that could both serve visual tracking information for AR, but also to inform on its capacity of coffee production. The decision to use fixed data was based on the expectation that the representation of the size of the generative shapes will remain accurate over time. The data used to generate these shapes included the overall export of green beans bags and overall ranking of exporting size for each country. While it is possible that these representations may change in the future as other countries expand their production, the approach taken was based on current trends in sensitivity to exposure and capacity to cope, in order to maintain leading exports. Solymosi and Techel (2019) note that current research and development of adaptive farming techniques is focused on countries with strong agricultural bodies, and it is likely that already strong exporting countries will maintain their rank due to better access to services and funding. Changes in conditions for other coffee-producing countries may not be noticeable for several years.
Real-Time Data Exploration
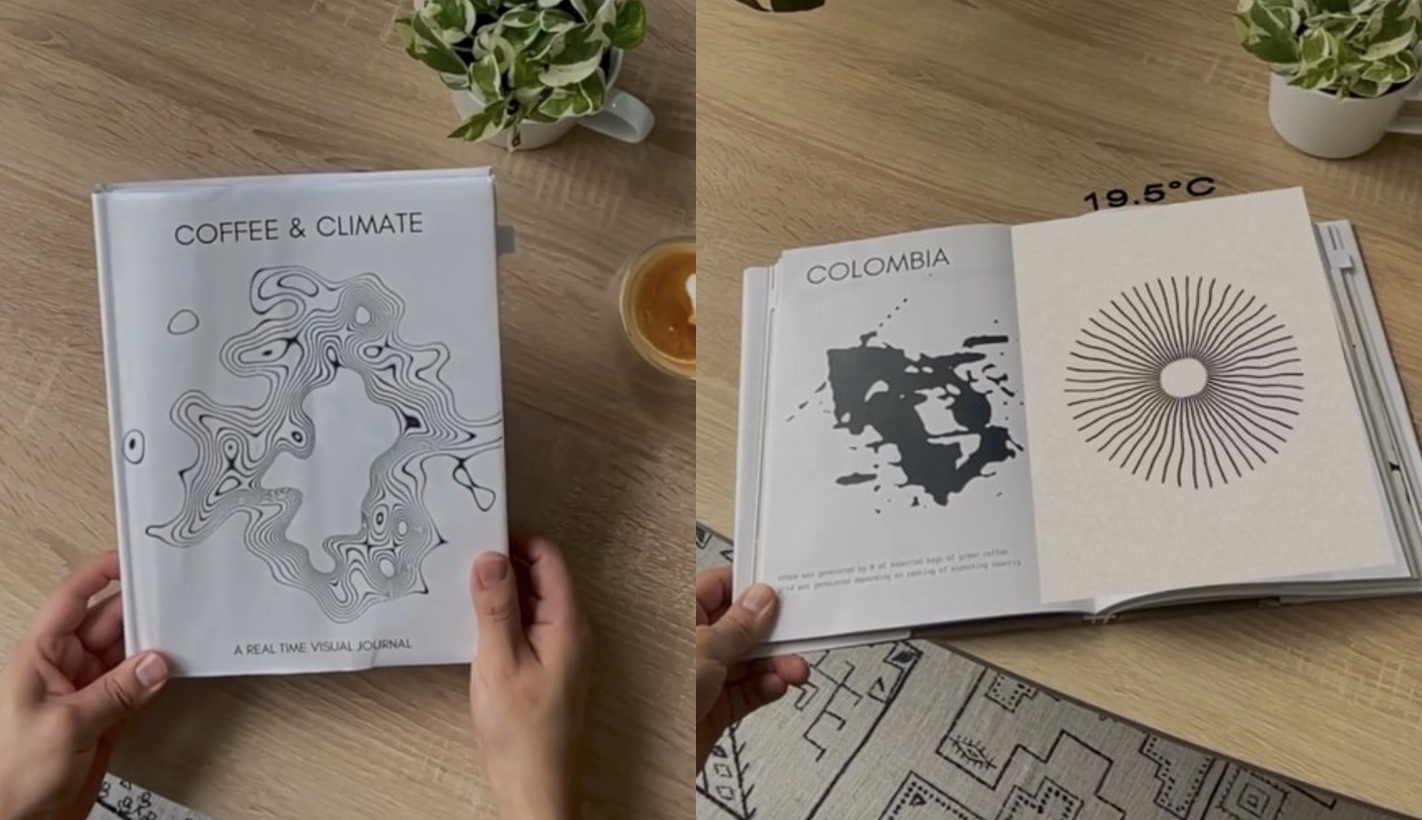
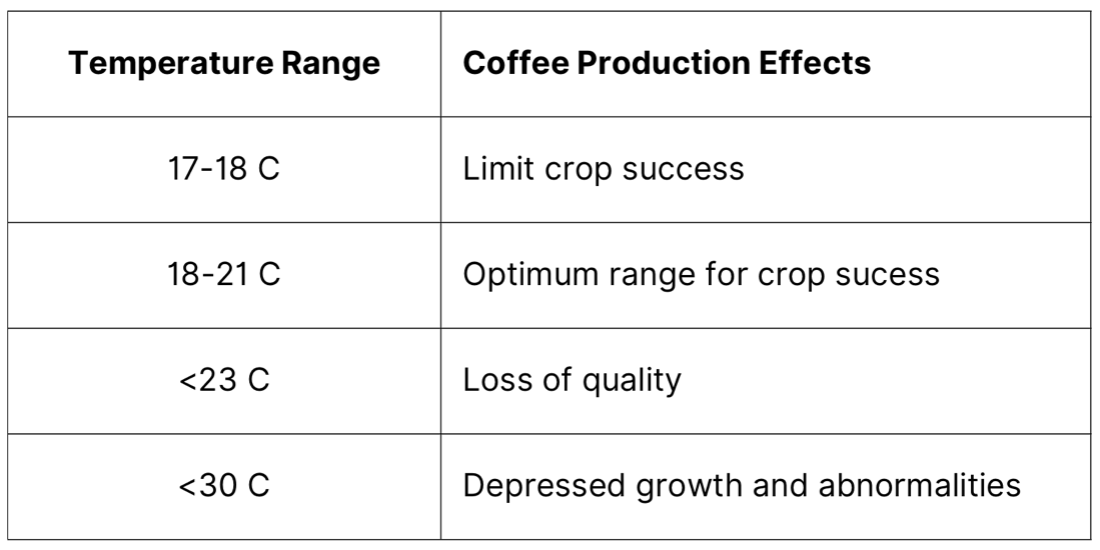
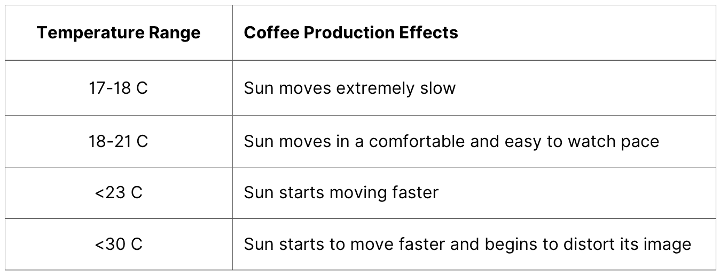
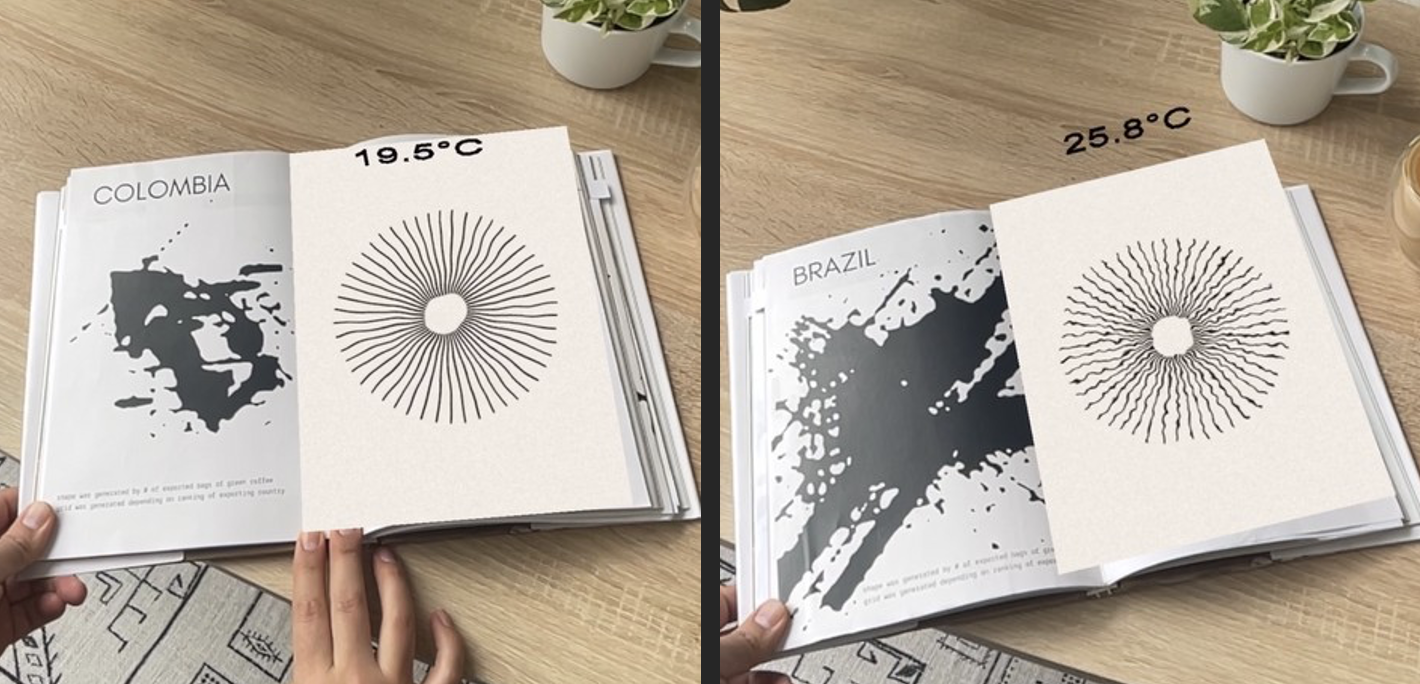
Weather patterns and daily temperature representation require a more dynamic approach due to their unpredictability. According to Froude et al. (2013), current atmospheric forecasting can only make an approximation of the time evolution of the atmosphere. Atmospheric states are constantly evolving and factors such as air pressure, cloud patterns, wind, and precipitation play an important role in forecasting weather. As these factors can change at any time, weather patterns can only be predicted for a short period of time. As weather plays a crucial role in green coffee production, this data must constantly inform and change. To visualize this, Coffee & Climate employs two approaches to display the current weather conditions in the largest coffee-producing region of each country. The first approach is a text display of the temperature in Celsius, while the second approach is a sun animation that reacts to the weather temperature value. These two approaches are achieved via Augmented Reality. By considering the temperature conditions outlined in Table 1, the sun animation conveys a sense of urgency by changing its movement when outside the range of optimal conditions for coffee growth.
According to DeCock-Caspell and Vasseur (2021), the use of data visualization can help overcome psychosocial barriers that are hindering behavioural change for climate action. Accessible visualization tools for climate change communication can lead to increased social learning and engagement. Climate action demands long-term planning and decision- making that requires critical understanding of the impact of climate change. By using weather data visualization tools like Climate & Coffee, viewers can interact with data in a more immersive way, facilitating faster connections that may inspire a more sustainable future.
Process
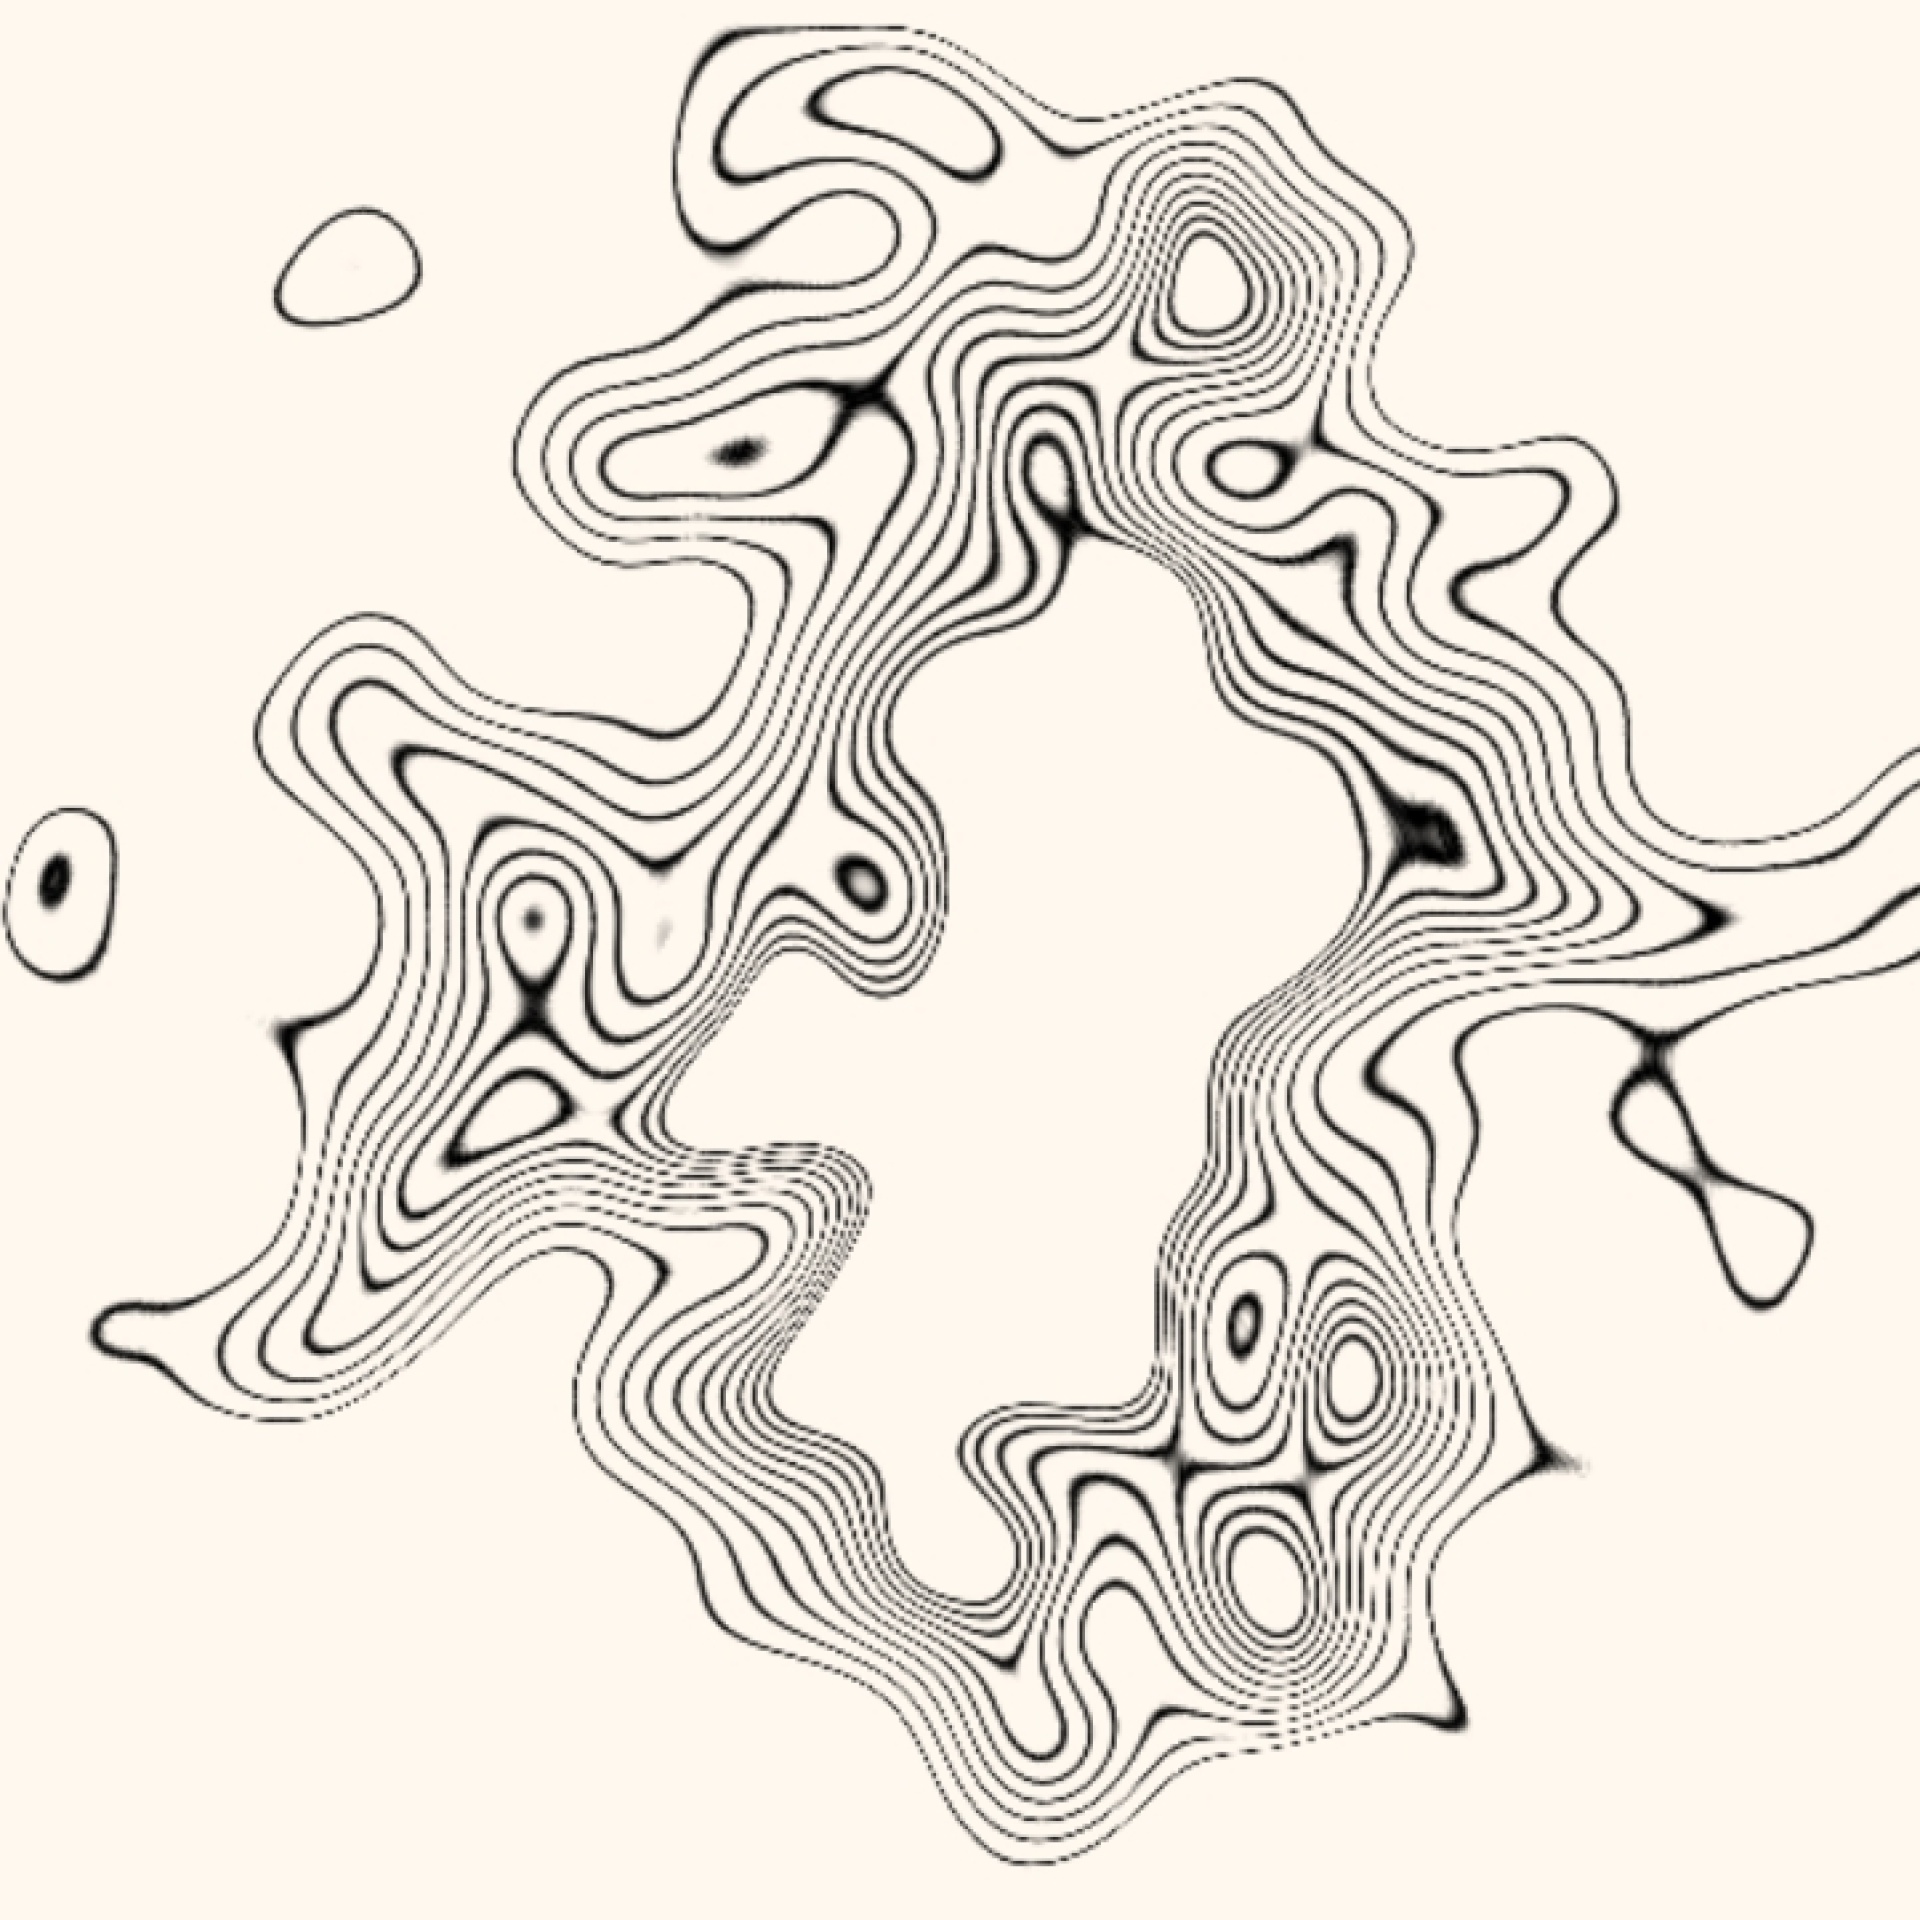
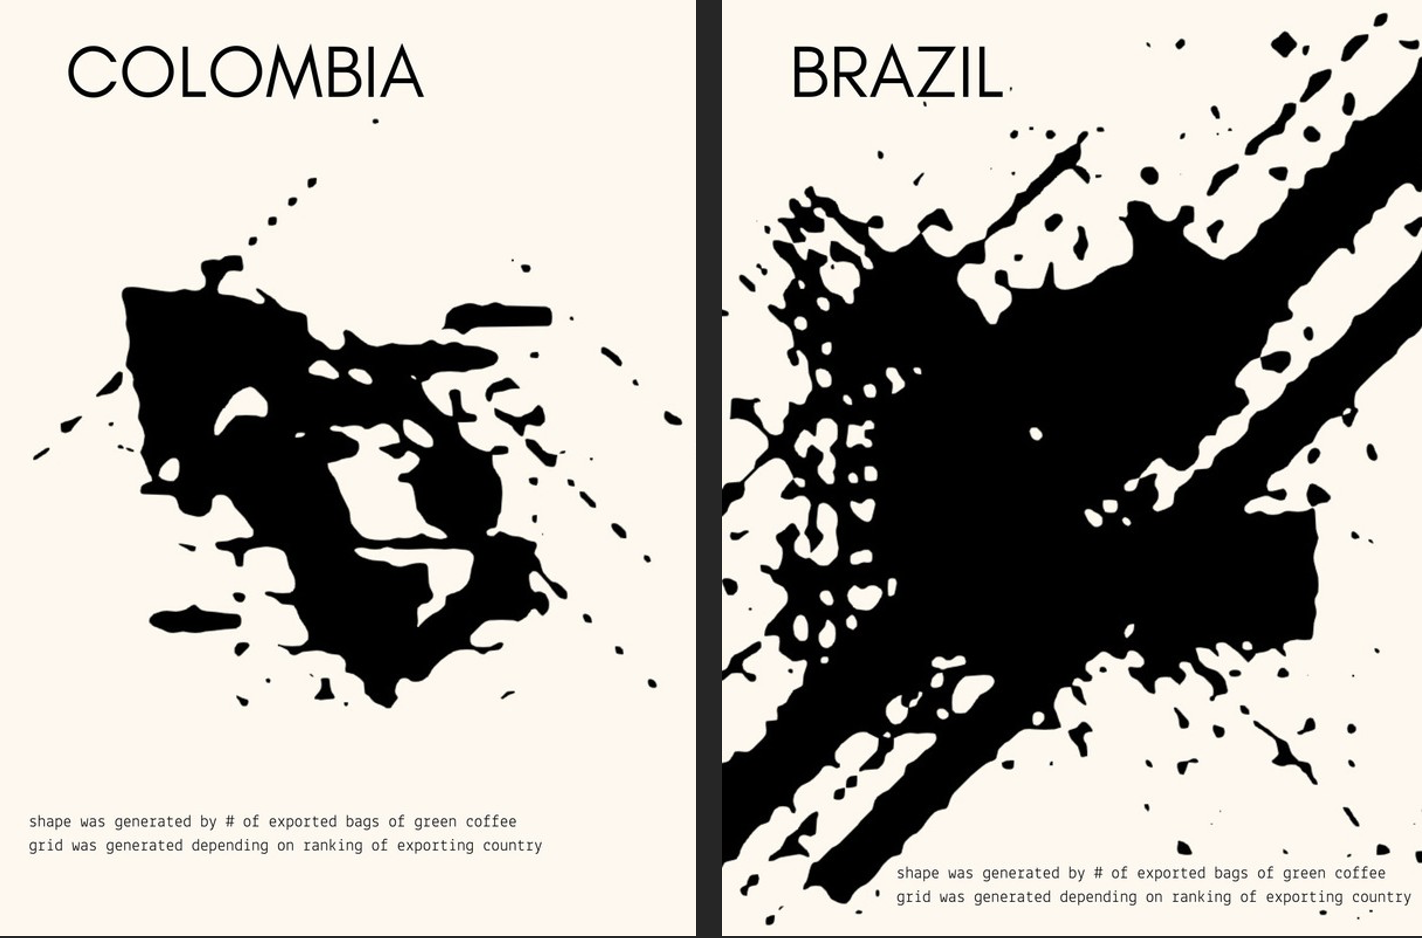
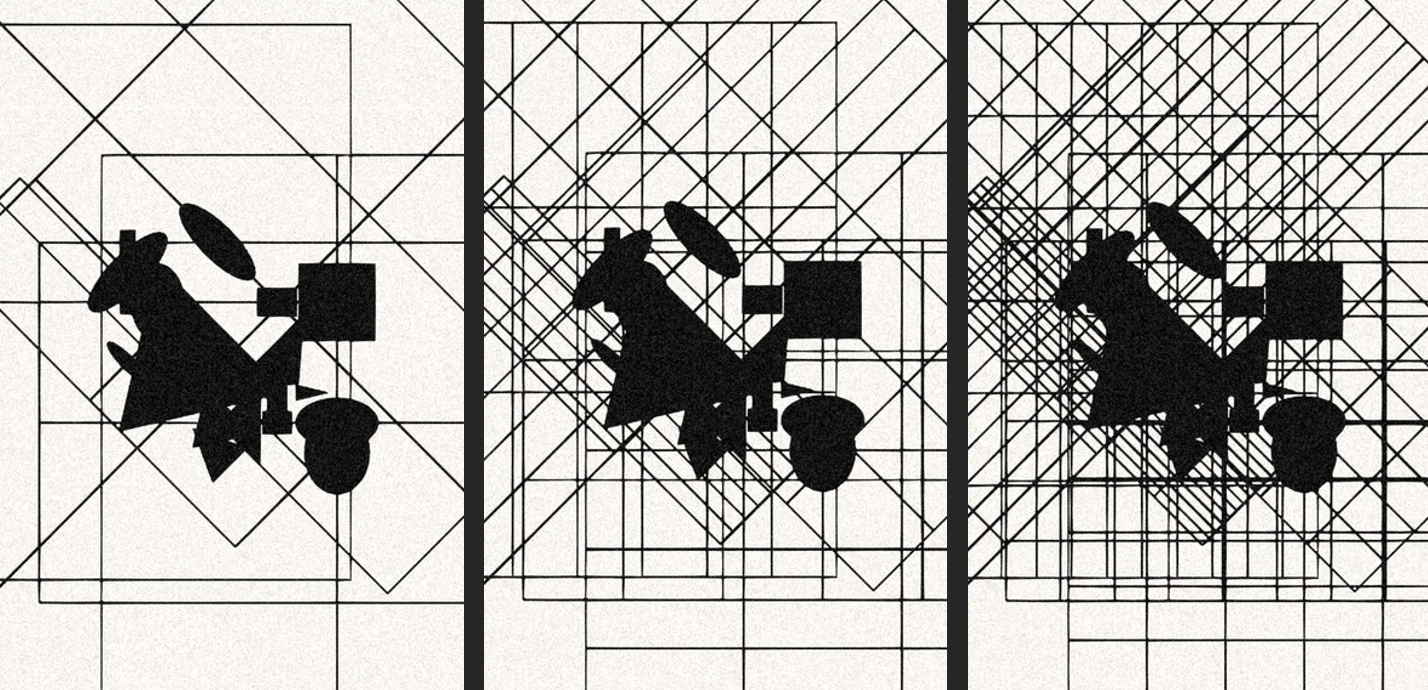
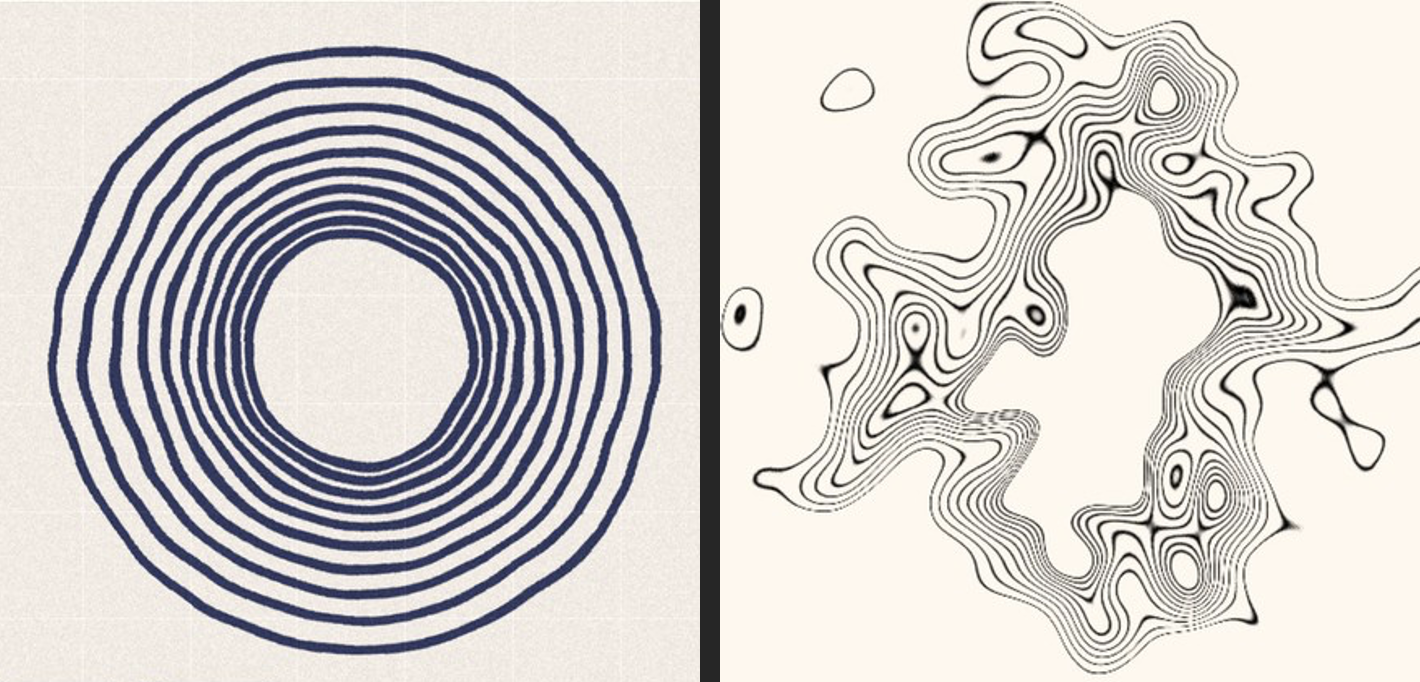
Generative shapes were created in TouchDesigner by using input data from coffee export values of Colombian and Brazil from Statista and BarTalks reports. Using several Geo COMPs as a basis, seed noise values were used in order to control the placement, rotation and scale of different shapes such as: circles, triangles and rectangles. Instancing was used to create multiple copies of each shape with different parameters, and then a blur and limit were applied to bring them together into a single shape. In addition, different visual grids were created to represent the ranking of exporting size by volume for each country, these grids were manually selected according to the reports. The input data was used to control the seed value of the noise script, which allowed the generative shape to respond to different parameters and create different patterns.
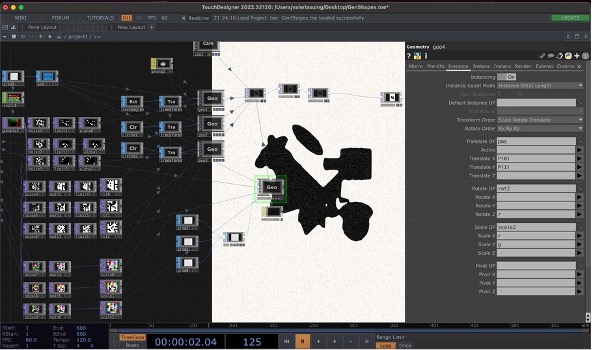
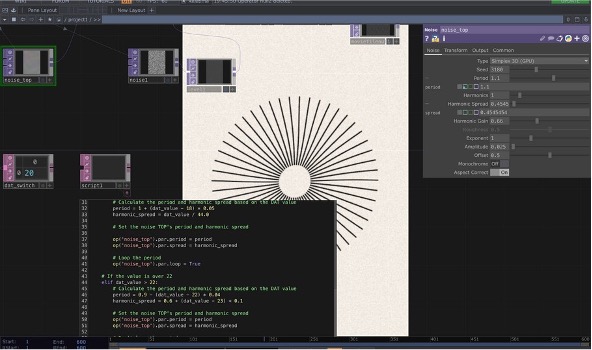
Sun animations were created in TouchDesigner using 50 lines distributed around a circle, with a noise TOP used to control the period and harmonic spread values to create motion to the animation. Several attempts were made to use real-time weather data from an API, but technical errors in the operating system occurred. Therefore, the values of noise were manually selected to display the animations, as discussed in Table 3. For each trial, the animations had to be updated to reflect the current weather. Future iterations of this work will require real-time integration to represent the dynamic approach of data in these animations.

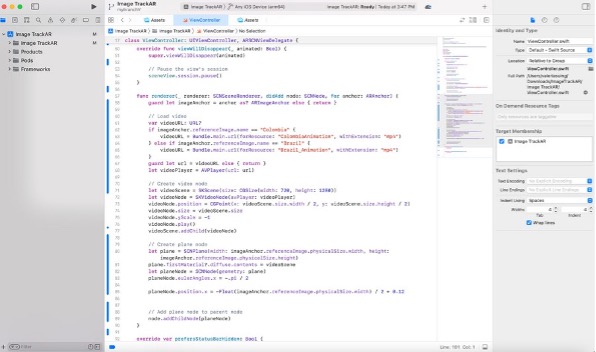
ARKit was used to perform image tracking and display the animation through a screen-based device according to the generative shapes created. The code retrieves temperature data from the OpenWeather API, which offers weather information for two cities, Jerico and Osasco, situated in popular coffee producing regions of the selected countries. This weather data is then used to generate a label that is incorporated into the AR view, alongside the sun animations produced using TouchDesigner. The label presents the temperature in Celsius and is updated in real-time, as new weather data is retrieved from the API.
To create a visually appealing cover page for the book, a similar approach to the sun animations was adopted. The goal was to create the illusion of a spilled cup of coffee by manipulating the size and scale of various circles and adjusting the values of period, harmonic spread, and amplitude using a noise TOP. Once the desired aesthetic was achieved, the text for all printed pages was added in Adobe Illustrator.
User Experience and Future Iterations
Climate & Coffee can serve as a valuable component of exhibitions focused on coffee or global sustainability. To facilitate engagement with the book, an accompanying app can be developed to allow attendees to interact with the book's content on their personal devices.
In future iterations, Climate & Coffee aims to incorporate more advanced features that respond to weather alerts in real-time. Using a nature-centric approach, the new animations will react accordingly to provide visual information about weather conditions that could urgently impact coffee production. Furthermore, the book could be expanded to include additional site-specific locations that provide a more comprehensive understanding of global coffee production. Additionally, further research can be conducted to highlight the most vulnerable areas at risk of coffee farm extinction. These enhancements will help to increase awareness and understanding of the impacts of climate change on the coffee industry and the need for collective action to promote sustainability.
Conclusion
Coffee & Climate aims to provide a more immersive and accessible way for professionals and consumers in the coffee industry to understand and engage with climate change. By using real-time data from coffee producing regions, the book's sun animations and temperature labels communicate the urgency for collective action in a visually intuitive way. As the book deals with real-time dynamic data, its future interpretation depends on the strategies that will be implemented collectively to keep coffee production sustainable. It can serve as a way to celebrate efforts to maintain coffee farms or as a cause for concern if climate change disrupts production in different regions.

Valeria Suing
Valeria Suing (she/her) is an entrepreneur and new media artist with a passion for social innovation and art. Valeria's focus is promoting ethical practices in the coffee industry and communicating Latinx heritage through her work.
Her cross-disciplinary practice has allowed her to approach all of her work through nature and human centric design philosophies. Valeria's aim is to solve problems and develop strategies based on research and trends.
Her practice is based on respect for all, creativity and community.
- Baskett, Nick. “BRAZIL COFFEE EXPORT REPORT SUMMARY - JUNE 2022 -.” BarTalks Limited, 15 Aug. 2022, bartalks.net/brazil-coffee-export-report-summary-june-2022. Accessed 15 May 2023.
- Bouchard, Fabien. “Instability of Nature - ParseError.” ParseError, 28 Dec. 2018, www.parseerror.net/portfolio/instability-of-nature-radioactivity. Accessed 3 Apr. 2023.
- ---. “Pollution (Is in the Air) - ParseError.” ParseError, 8 Sept. 2020, www.parseerror.net/portfolio/pollution-is-in-the-air. Accessed 3 Apr. 2023.
- Burkey, Nora, et al. “Carbon and Coffee: GHG Emission Reductions Progress and Strategies Across the Value Chain.” A Specialty Coffee Association Report, 2022, static1.squarespace.com/static/584f6bbef5e23149e5522201/t/63496b8296556f2030bf45da/1665756035877/SCA_Carbon_and_Coffee_Report_2022_EN.pdf. Accessed 5 Apr. 2023.
- Craig, Alan B. “Understanding Augmented Reality: Concepts and Applications.” Elsevier Science & Technology, Apr. 2013. ProQuest, ebookcentral.proquest.com/lib/oculocad-ebooks/reader.action?docID=1183494&ppg=4. Accessed 3 Apr. 2023.
- Davis, Aaron, et al. “The Impact of Climate Change on Indigenous Arabica Coffee (Coffea Arabica): Predicting Future Trends and Identifying Priorities.” PLOS ONE, vol. 7, no. 11, Public Library of Science, Nov. 2012, p. e47981. https://doi.org/10.1371/journal.pone.0047981. Accessed 5 Apr. 2023.
- DeCock-Caspell, Meredith, and Liette Vasseur. “Visualizations as a Tool to Increase Community Engagement in Climate Change Adaptation Decision-making.” Facets, vol. 6, no. 1, Canadian Science Publishing, Feb. 2021, pp. 240–51. https://doi.org/10.1139/facets-2020-0032. Accessed 3 Apr. 2023.
- Froude, Lizzie S. R., et al. “Atmospheric Predictability Revisited.” Tellus A, vol. 65, no. 1, Wiley-Blackwell, June 2013, p. 19022. https://doi.org/10.3402/tellusa.v65i0.19022. Accessed 1 Apr. 2023.
- Morton, John M. “The Impact of Climate Change on Smallholder and Subsistence Agriculture.” Proceedings of the National Academy of Sciences of the United States of America, vol. 104, no. 50, National Academy of Sciences, Dec. 2007, pp. 19680–85. https://doi.org/10.1073/pnas.0701855104. Accessed 5 Apr. 2023.
- Open Weather Map. Сurrent Weather and Forecast - OpenWeatherMap. openweathermap.org. Accessed 10 May 2023.
- Solymosi, Katalin, and Grit Techel. “Brewing up Climate Resilience in the Coffee Sector.” Sustain Coffee, 2019, www.sustaincoffee.org/assets/resources/Brewing_up_Climate_Resilience_in_the_Coffee_Sector.pdf. Accessed 5 Apr. 2023.
- Statista. “Colombia: Coffee Export Volume 2017-2022.” Statista, 14 Jan. 2022, www.statista.com/statistics/1018292/coffee-exports-volume-colombia. Accessed 15 May 2023.
- The Mediated Matter Group. “Project Overview - Making Data Matter: Voxel-printing for the Digital Fabrication of Data Across Scales and Domains.” MIT Media Lab, 2018, www.media.mit.edu/projects/making-data-matter/overview. Accessed 3 Apr. 2023.
[i] For more information about The Mediated Matter group, see www.media.mit.edu/projects/making-data-matter/overview.
[ii] For more information about the Instability of Nature, see https://www.parseerror.net/portfolio/instability-of-nature-radioactivity/
[iii] For more information on Pollution, is in the air, see https://www.parseerror.net/portfolio/pollution-is-in-the-air/